Brian Abad, Amy Alba, Connor Beirne
Overview
Income inequality has increased in the U.S. over the last 50 years. The gap between lower and higher income groups has increased. Lower and middle-income groups end up with relatively flat incomes while incomes at the higher end have grown significantly as shown on the graph (Stone, n.p.). To be specific, during the beginning of the time period being studied, the 1970s, economic growth began to slow, while the income gap began to widen to levels previously seen in the 1920s (Stone, n.p.). The figure below shows the income gain patterns for all income levels from 1979 to 2015 (Stone, n.p). It is exhibited that income has quadrupled for the top 1% relative to low and middle-income households.
This increase in the inequality of income distribution is why we have decided to dedicate a chapter discussing U.S. trends in income inequality. We will be discussing both recent and past trends in the distribution of wealth, what has caused these trends to occur and the effects that these trends have had on income inequality. Once we set the stage for the history and background of growing income inequality in the United States, we will assess how the structure of the education system along with healthcare plays a role in the growing disparity. These fundamental issues play into the overarching topic of income inequality in the United States, the effects of which will be conveyed throughout this chapter.
Trends in the Distribution of Wealth
Differences In U.S. Wealth Distribution from the 1980s
Wealth is described as the value that someone holds on property or assets. The wealth distribution in the United States would make the most sense to describe it as a ladder: the top half of rich families, the middle-income families and the lower half of the ladder where poor families are located. “Wealth in the form of owner-occupied housing provides services directly to its owners and wealth is a source of consumption, independent of the direct money income it provides, because assets can be converted directly into cash and thus provide for immediate consumption needs” (Wolf, 1). It is also valid to suggest that peoples accumulation of wealth depends on the stage of the individual’s life cycle. Normally, the youth of America will not have much wealth as middle-aged or elderly Americans. Individual characteristics matters as well, not everyone is going to have that drive to become a millionaire and distribution of this behavior across the United States is not spread proportionately. Growth of the top three percent of rich American families have grown between the 1980s and 1995, middle-income level families have shrunk ten percent lower in 1995 then they did in the 80s. The extensive amount of household wealth that was held by rich families perhaps resembles the financial opportunities they have compared to lower income families between the 1980s and late 1990s in the United States. The wealth accumulation of households has dramatically changed, in its composition, and in its generation. The effects can be tracked by wealth over time to identify differences in the creation of household fortunes and its intergenerational cycles.
Women’s Role in Wealth Concentration and Mobility
The concentration of wealth and family fortunes has changed over the last few decades and has been heavily influenced by broad societal changes and factors of production. It can be observed that the concentration in wealth at the top .1% bracket, in the 1960s, had a composition of women near one-half. Since the 1960s the composition of women to men in the top .1% bracket has been steadily decreasing, bottoming out at one-third, and only mildly increasing since the 1970’s (Edlund, L, 163). This study illustrates the change in the composition of women at the top .1% overtime against the nature of rising income inequality. Assuming women do not create wealth, as there is less than 1% of females in the composition of all self-made billionaires is in the U.S., but both men and women inherit it. One can observe that the decrease in wealth concentration held by women has been exacerbated by technological innovations along with changes in factors of productivity growth since the 1960s with men creating new fortunes.
Technological advancement has tremendously increased fortunes in the self-made category creating a disparity between old fortunes and new fortunes. This is reflected in the decrease of females in the top .1% between the 1960’s and the 2000’s. The observed long-term trends of intergenerational mobility of wealth since the 1960s also supports a growing disparity between rich and poor resulting in increased income concentration among the top 1%. The decreased wealth concentration among women can, therefore, indicate an increase in intergenerational mobility among the top 10% due to the creation of new wealth by men and the diminishing number of fortunes retained from old money being passed down to women. This supports the notion that factors of productivity increasingly rely on high skill individuals for production, increasing their wages, which leads to increases in disparity between those in the top quintile and those low skilled individuals in the bottom quintile.
Causes of Decline of Labor Unions
Unions are designed to help set the standard for wages, benefits and working conditions for workers that the state cannot force companies into providing for their employees. Unions gained popularity when mass production technologies relied on unskilled labor during the industrialization era and declined due to computers and automation. In other words skill-biased technological change led to the decline of labor unions (Dinlersoz, 129). The large demand for unskilled labor in the beginning of the 20th century resulted in a larger payoff to unionizing it (Dinlersoz, 129). As the Age of Industrialization made way for the Information Age, the fall of mass productions and the increase of advanced technology led to the decline of labor unions which led to the payoff of unionizing unskilled workers to decline as the demand for skilled workers increased (Dinlersoz, 131).
Decreased political support for unions along with the rollback of laws that favored unions also led to the decrease in unionization (Dinlersoz, 136). An example of the business community trying to diffuse unions is the Taft-Hartley Act in 1947, which outlawed closed shops and required an 80-day notice for strikes (Dinlersoz, 137). The chart above shows that unionization fell from about 25% of employees in the 1970s to about 10% by 2015 (Bachman, n.p). As high-income groups pushed for deregulation, labor market policies began to favor the well being of big corporations over the small people that work for them. For this reason, the 1% take home a continuously increasing share of total income while the lower half increasingly take home less (Bachman, n.p).
Skill-Biased Technological Change due to Globalization & Industrialization
People have migrated to America, from long and far to begin a new life, to take part in what was known as the land of opportunity. While some people succeeded in achieving their goals of prosperity, as big businesses became more monopolistic in character, they made it their duty to keep themselves from losing wealth and low-income individuals from gaining it. As low-skilled American jobs began to be moved abroad due to the low-cost competition in emerging countries, the primary one being China, American jobs in the apparel and textile industry disappeared. American workers could not compete with the lower wages that Chinese workers were willing to take along with their supply of labor, which is about four times bigger than the American labor force. In the 1990s alone about one million jobs in the manufacturing sector were lost to the Asian labor force (Bachman, n.p).
While the industrialization of America helped make her the modern, powerful nation she is today, the working class factory workers that big businessmen tormented to get where they were, have been too many to say the outcome outweighs the costs. Industrialization changed the definition of what the land of opportunity was by making workers easily replaceable during the Age of Industrialization. Being easily replaceable gave lower-skilled workers limited chances to negotiate for job opportunities and pay, creating a permanent stratification between rich and poor.
The growth in information technology during the Information Age caused an increase in demand for highly skilled, highly educated workers leading to a decrease in demand for unskilled workers. The gap in demand between skilled and unskilled workers ultimately led to unskilled workers being replaced with technology that could do their work in a much more cost-efficient and time-efficient manner. This shows that technological changes have allowed highly educated individuals to flourish compared to uneducated individuals, however, this is only part of the story.
Technology has also allowed those who were already rich to become richer due to their increased ability to communicate with the rest of the world and “capture a larger share of the market” (Bachman, n.p). An example would be a world-renowned financial planning business having clients all over the world rather than just in the geographical region that it resides. Technology allows companies to operate at a larger scale by delivering more goods and services globally which allows them to accumulate more wealth.
Changing Political Climate
When President Trump was running for office one the driving factors in his campaign was his plea to deregulate businesses. To be specific Trump said, “We will no longer regulate our companies and our jobs out of existence…” (Becker, n.p). Deregulation widens the income inequality gap because it results in “less stringent investigations into labor disputes… [which] benefits businesses more than wage earners” (Amadeo, n.p). An example of this is the Tax Cut and Jobs Act that president Trump ratified at the beginning of 2018 which has done nothing to help working class people. On the contrary, the economy is expected to lose $1.854 trillion between 2018 to 2028 due to the macroeconomic effects generated by this tax cut (Slemrod, 82).
It is also relevant to mention that more than half of the benefits are at the top 10% which shows that tax cuts are disproportionately given to high-income households (Slemrod, 88). To break it down, “The top 1 percent of income earners gets a tax cut in 2018 of $51,140, the average member of the middle quintile receives $930, and the lowest quintile gets just $60 on average; these dollar figures amount to a 3.4, 1.6, and 0.4 percent increase in after-tax income, respectively” (Slemrod, 88). Although it may seem like the Tax Cut and Jobs Act is helping our economy flourish because it increases profit margins for corporations and their CEO’s.
Differences in Human Capital
Differences in human capital have contributed to the widening income inequality gap because people without the skills, education, and training that are needed to fill vacant position, will suffer through job displacement. The amount of job displacement that certain groups face, raises the argument that structural unemployment has been created out of the market failure that occurred after The Great Recession. The graph below shows that there has been a sharp increase in total unfilled job vacancies for the United States since the Great Depression, portraying that employers continue to create new jobs in the market, however, there aren’t enough well-educated people to fill these positions.
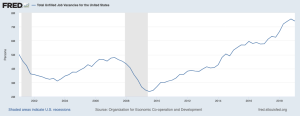
There is an increased demand shock for well-educated workers along with a decreased supply shock of workers with the appropriate amount of human capital necessary to fill these positions. This may have occurred due to the computerization of everything forcing people out of the manufacturing industry along with the continuously increasing cost of tuition forbidding lower skilled individuals from getting a degree and obtaining the positions that are vacant.
Advertising’s Effect on the Masses
Due to the profound amount of products in the market, creative sorts of advertising have been contrived in order to make products stand out to the consumer, manipulating the viewer’s mind to the extent that advertisers make us want things we don’t need. As society becomes fixated with the superiority technological innovations allow individuals to feel, they begin to lose sight of the implications the expenses can have on their household. Constantly getting signals that we want more than we can afford, “…the desire to spend doesn’t go away” (Dachis, n.p.).
Although it is much easier for a wealthy person to purchase new things than for a less privileged person low income individuals trade up something out of style for something new all the time. Yet again, advertisers have fault in people’s desire to constantly upgrade to something new because advertisers have convinced the public that the updated version of a certain item one owns, is tremendously more efficient than something they already have. This particularly affects low-income households due to their lack of financial literacy disabling any rational purchasing stops which are beyond their means deepening their poverty.
Is There Equal Distribution Between High and Low-Income Individuals Within The Education System?
The demand for education has tremendously increased due to the return on schooling after receiving a degree, bachelors or masters. Receiving a higher education in the United States does not come easy for some. Families that reside from poorer backgrounds struggle with financial restrictions inflaming the issues on why students do not attend college in the first place. Student loan debt, for example, is one of the leading reasons why people do not complete education as a whole. When educational debt is high there are lower levels of completion of education, and if educational debt levels are lower, less of a burden is placed on the student and will have higher levels of education completion. College graduates from low-income families suffer from the mass amount of student loan debt after receiving a degree because they do not realize actually how much is being invested in educational programs and training. Middle and low-income graduates do not have the capability of reimbursing the investments without sacrificing the luxury of living comfortably, therefore college programs and universities should make an effort to mitigate the cost of tuition. A solution to this may be a combination of subsidizing public colleges and treating the expenditure of education as consumption. Giving graduates with high levels of student debt to raise their wealth which will eventually pay dividends, leading to more frequent payments and less debt for the individual (Popescu, n.p). It is important to say that if more subsidized programs are implemented for lower-income families,
In addition, to the student loans being a large issue, rising costs are also a large issue in distribution levels of education. Rising costs for low-income households have formed a problem where individuals have to allocate their income towards finances rather than commodities that add the stock into human capital. Low-income households ones in bottom quintiles to be more specific have financial challenges, which results in low financial health and a lack of investment in education. In addition, an average of 60 percent of low-income households has $500 or less after paying rent and other necessities like food, transportation, and healthcare. The opportunity that low-income households are presented with is not very promising. From the fact that families will have low residual income; creating low chances to attend a high-quality secondary education and or complete it.
A recent study shows individuals who were educated in states with higher quality institutions have a higher return on additional years of secondary education. However, in this study, some argue that the wage of teachers in higher quality states also impacts the quality of education which results in higher returns. With a 30 percent raise in teacher salaries, the rate of return to education of high school graduates who go to college increases by 1.2 percent (Card, Krueger, 21). One issue with focusing on the quality of schooling may widen the distribution of earnings and not raising the average increase in income. The quality of schooling and institutions do not only have positive effects on wages earned after receiving a degree but also put them at an even playing field with individuals in larger wealth distributions. Gains of higher quality education offset the losses when there is a shift in earnings, this leaves individuals in the lower distribution well off as middle to high-income individuals (Card, Krueger, 23).
There are opportunities for free education but there are restrictions as well. Education systems can make it difficult for high school graduates to receive higher quality education due to tuition or competition. Higher education in the United States is very expensive in respect to the quality of resources students are offered, but the students/families in the lower half of distribution level cannot afford to seek secondary education. Richer families tend to go out of the way to purchase applications or resources like tutoring in order for their child to be successful. Again, rich families go to extraordinary lengths like bribing school officials or paying an individual to take an entrance exam for their children to receive a secondary education. In result, students that come from richer families have more of an educational opportunity to attend a highly selective college; which will transfer to a greater return when entering the labor force. However, Educational opportunities are limited to unfortunate families creating an unequal distribution of education and growing income inequality between high and low-income level Americans, which essentially impacts the structure and distribution of wages.
Structure of Education and Return on Schooling
Structure of education and the impact on wage distribution
Education is a large investment for some, upgrading skills regularly through education, training or experiences increases the opportunity to become more successful. Incentives to invest are tied to the return on skills. The interest of acquired skills such as, learning new computer software or learning how to make a sales pitch arises from the return on those specific skills inquired. People want to invest in their human capital, therefore you see more students graduating high school and attending colleges. “The standard theory of human capital implies that higher returns to skills should encourage investments in human capital” (Acemoglu,1). Receiving a post-secondary education is relevant to the result of a higher income, greater job decision, and financial and mental security.
Before the 1980s, investing in yourself and obtaining additional skills and education was not always of interest due to lower-skilled workers being able to live off the wage rate at that time. However, throughout the 1980s there were significant changes in the United States wage structure. The returns on schooling increased by almost a third (Bound & Johnson, abstract). In fact, people gradually started to invest more education and training, treating it as a financial investment. Realistically, having a higher education will not only create more opportunity in the labor force but will generate more general skills and training that can be carried over to future engagements in the labor force. It is clear “schooling could also lead individuals to make better decisions about health, marriage, and parenting style. Some suggest schooling improves patience, making individuals more goal‐oriented and less likely to engage in risky behavior” (Oreopoulos & Salvanes, 4). The evidence suggests that higher education will result in higher returns on schooling, which is plausible and justified. More of an opportunity is granted for those who choose to add additional skills to the stock of their human capital and move forward with their professional skills. In other words, individuals who do receive additional years of school will have greater net marginal benefits internally and externally that are positively affiliated with the impact on society than those individuals who do not. A recent study shows that “better education for more inclusive social groups has been positively linked to economic growth and development. Besides, education helps to increase social cohesion and to reduce income inequality, although complementary conditions may be required”(Vila E. Luis, n.p). With this suggested evidence, the investment in higher education bestows more social values upon the child and establishes a healthy development of socially accepted norms that will be developed more in the future as the individual proceeds with additional training and human capital.
However, one must take into account when someone graduates from a university and enters the labor force during an unexpected recession. Most likely, this will create a halt in the increase of lifetime earnings after schooling, but a recent study shows that students who graduate from college are likely to be happier than high school dropouts (Oreopoulos, Philip, and Kjell G Salvanes, n.p). Attaining a higher education tends to generate a larger return on earnings in wage but also on non-monetary values as well. Benefits like medical insurance, options in stock, dental insurance, paid vacations and pensions are likely to be obtained by those with higher education (these are non-monetary gains from schooling which are not taken into account when measuring pecuniary returns to school).
Trends in Different Income Level: Implications
Income Gap in the United States
In addition, while the rich concentrate on stock assets, the middle class focus primarily on housing assets. The issue of inequality then begins where after the 1990s stock assets were generally held largely by the rich and middle income families usually have a larger share of housing assets, creating a gap of missed financial opportunity investing in the stock market for the middle-low income individuals. The rich do not hold a burden of the increase in stock prices relative to housing pricing, therefore with the giant gain in returns on stocks created an income gap between rich and middle class citizens. The market highs of the stock market benefit net value of the rich and leave the middle/lower class with a negative net value due to the sore in pricing. For most households, wealth accumulation has stagnated in this period where living styles fluctuate and become unpredictable. The graph below presented by Board of Governors illuminates the increase in shares of income for the top five percent of rich households. As illustrated below, the top five percent of wealth distribution from 1989 to 2013 has grown immensely because the gains were largely supporting those individuals at the top of the distribution.
Income Trends Over Income Levels
When breaking up total income levels for different income levels the Haig-Simons definition of income provides a good relative base for calculating income changes isolating for cashflow consumption and net worth. Since the Haig-Simons measure is income equals consumption plus the change in the net wealth, in the year trailing, and this metric in particular enables a better understanding of the effects of capital gains on yearly income level changes. This allows a better understanding of the impact capital gains has on the growing disparity between high and low income individuals. The accrued changes to capital gains, or losses, is applied to income level change over the year regardless of whether or not the underlying asset was sold for a taxable loss. Being able to gauge this change in capital gains, when using a data set as a composite of changes to income for U.S. households, reveal a trend which, “contradicts the notion that income inequality fueled by capital gains at the top end of the distribution has dramatically increased”(Philip Armour, 290). When looking at the trends of income growth over 1987-2010, using this methodology of tracking, one can observe a much more volatile income trend but slower overall growth among the top quintile in society versus the bottom quintile. Tracking year over year changes in overall income growth and disparity among the top and bottom quintiles, this slowdown results from economic contractions. However, when including taxable realized gains or losses in the event of a realization, the disparity in income levels is much larger year over year.
This can lead us to the conclusion that the realization of gains or losses across the upper quintile income level greatly affects the disparity against the lower quintile income levels. Excluding unrealized gains or losses in the calculation of income level change provides a better overall trend of actual growth in disparity among the top and bottom quintiles. The supporting idea being that year over year trailing results are much more pessimistic towards the growth of income levels of the top quintiles and underrepresented disparity. This occurs because the actual gains on capital have a greater, real value of capital, and thus larger impact when not accounting for accrued unrealized gains or losses which are non-taxable, changes in capital.
Trends of Purchasing Power at Different Income Levels
Purchasing power is defined as the ability to purchase different commodities that you can afford. Families in the higher income distribution level have more purchasing power compared to those at the bottom of the distribution. Research shows, “Americans at the upper end of the income spectrum were spending five times as much per child as low-income families. By 2007 that gap had grown to nine to one; spending by upper-income families more than doubled, while spending by low-income families grew by 20 percent” (Tavernise, n.p). The income people generate with respect to prices in the market, determine how the consumers purchase their goods. In addition, individuals with higher income levels will yield a greater portfolio of growing investments that ensure a profitable future. Richer individuals will be more comfortable with investing in financial institutions and accumulating wealth. In the market, prices are bound to change and consumers must adjust income in respect to price level fluctuations. Again, if someone’s income remains constant and the price level rises the purchasing power of the consumer falls.
Purchasing power can also be measured by looking at the Consumer Price Index (CPI), which measures price level changes of consumer goods adopted by households. Viewing the CPI changes within the last 12 months in the United States represents the number of income individuals has to adjust in order to allocate income efficiently.
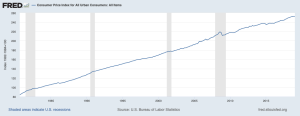
The chart above represents the United States Consumer Price index from the year September 1980 – January of 2019. In logical reasoning, consumers face higher prices and are now looking for cheaper ways to find the “best deal possible” which drastically impacts GDP because less consumption is taking place. The consumer spending of an individual at the top 10 percentile of income distribution is drastically different because of the behavior of the individual. Depending on the individual, if someone grew up in a rich household, individuals spending behavior may be different compared to an individual who grew up in a one bedroom apartment and struggled financially. Therefore it is safe to say, richer families with greater consumer spending are likely to allocate towards more wealth accumulation services such as annuities or stock assets. Unfortunate families in the lower income levels will find it difficult to invest in assets such as stocks and annuities due to the fact of the matter of not having the time or money to follow through with future investments.
Income Gap in the United States
In addition, while the rich concentrate on stock assets, the lower income individuals focus primarily on housing assets. The issue of inequality then begins where after the 1990s stock assets were generally held largely by the rich and middle income families usually have a larger share of housing assets, creating a gap of missed financial opportunity investing in the stock market for the middle-low income individuals. The rich do not hold a burden of the increase in stock prices relative to housing pricing, therefore with the giant gain in returns on stocks created an income gap between rich and middle income families. The market highs of the stock market benefit net value of the rich and leave the lower income households with a negative net value due to the sore in pricing.. The graph to the right illuminates the increase in shares of income for the top five percent of rich households. As illustrated below, the top five percent of wealth distribution from 1989 to 2013 has grown immensely because the gains were largely supporting those individuals at the top of the distribution.
Health Care’s Role in the Growing Disparity
The overall health disparity of those in the top 10% and bottom 10% has increased with the growth in income inequality but health care costs have also played a role in deepening that disparity. Public health initiatives have historically been the cause of improvement in life expectancy and social mobility with the intention of preventing a perpetual state of systemic issues declining the life expectancy of those in poverty. With a recent upward trend of income inequality over the last few decades, the systemic issues that cause diminished access to health care have become more prevalent for those in poverty. Progress on initiatives that increase the availability of healthcare for impoverished people has been adversely affected by recent legislation cutting programs like SNAP and Medicaids budgets.
The American Medical Association has used census data to conclude that there is a “gap in life expectancy of about 15 years for men and 10 years for women”(Chokshi, Dave A, 2) between Americans in the top 1% and Americans at the bottom 1%. Cuts in social welfare programs, in response to tax breaks for large corporations, and increases spending elsewhere in the budget, has led to a deepening in income disparity. Further worsening the disparity, Americans in the bottom percentiles of the income distribution have to spend more in healthcare relative to their wealthy counterparties which initiates a cycle of illness due to poverty and poverty due to illness. The already low purchasing power of the impoverished is then worsened by outflows from healthcare costs. These negative effects which come with growing income inequality have made it difficult for economic intergenerational mobility. With parents further impoverished by illness, they also face an inability to prevent illness by living a healthy lifestyle due to and their associated costs. This decreases possible capital allocation of parents to their children’s educational attainment and overall health. Thus, leading to a worsening long-term disparity between the wealthy and impoverished.
Conclusions
The structural, legislative, and production components of the overall economy has increased income inequality over the last few years. These worsening conditions on income distribution have grave implications for low income individuals and on the intergenerational disparity between the rich and poor. The technological reasons for this disparity have increased over the last decades but there are other fundamental socio-economic factors which contribute to the overarching topic of income inequality.
The implications of standing income levels against income trends across the top and bottom quintiles of society compound the issue. With the purchasing power of the top quintile being far greater this is reflected in their returns on investment and capital gains which is growing at a faster rate than the bottom quintile. Their high income levels are increasing faster than the bottom quintile because the percentage of investable assets far larger relative the bottom quintile increasing their incomes at a faster rate.
Returns on education are increasing with factors of production and total output growing increasingly reliant on technology raising the demand for highly skilled labor. Wealthy parents recognize the potential returns on an advanced education and are capable of investing more resources in the human capital of their child. This is reflected in the high attainment of postsecondary education from children with high networth parents. With the impoverished lacking the resources to improve their child’s educational attainment the child experiences a decreased probability of future schooling and the returns thereafter. This had deeped the intergenerational disparity of income inequality.
Impoverished individuals lack a high, well rounded, education and thus are negatively affected beyond wages. Healthcare for the impoverished is lacking as their low-skilled jobs are very unlikely to provide healthcare and without resources and education there is very little knowledge on illness prevention. The larger expense healthcare afflicts on the impoverished decreases their potential investable income, and cash flows, making for a larger contributing factor healthcare plays growing income level disparity.
With legislation shrinking the social net designed to alleviate factors contributing to the vicious cycle of poverty. Along with the Trump Administration increasing the tax burden on the American people and providing tax cuts for corporations. The income disparity is not being corrected by the legislators which, historically, have been the sole proprietors of policy mitigating economic inequality. The factors of production are going to be increasingly reliant on technology and without government intervention in favor of bolstering income equality, there is little decelerating the growing income levels of the high income and accelerating that of the low income.
References
Acemoglu, D., & Pischke, J. S. (2001). Changes in the wage structure, family income, and children’s education. European Economic Review, 45(4-6), 890-904.
Amadeo, Kimberly. “The True Cause of Income Inequality in America.” The Balance, 7. Nov. 2018, www.thebalance.com/income-inequality-in-america-3306190.
Armour, P., Burkhauser, R. V., & Larrimore, J. (2014). Levels and trends in U.S. income and its distribution: A crosswalk from market income towards a comprehensive haig-simons income approach. Southern Economic Journal, 81(2), 271-293.
Bachman, Daniel. “Income Inequality in the United States: What Do We Know and What Does It Mean?” Deloitte United States, 12 July 2017, http://www2.deloitte.com/insights/us/en/economy/issues-by-the-numbers/july-2017/rising-income-inequality-gap-united-states.html.
Becker, William S. “Why Regulations Can Be Good.” HuffPost, 7 Dec. 2017, http://www.huffpost.com/entry/why-regulations-can-be-go_b_13351686
Berg, Sanford V. “Annals of Economic and Social Measurement, Volume 4, Number 1.” NBER, http://www.nber.org/books/aesm75-1.
Card, David, and Alan Krueger. “Does School Quality Matter? Returns to Education and the Characteristics of Public Schools in the United States.” Feb. 1990, doi:10.3386/w3358.
Chokshi, Dave A. “Income, Poverty, and Health Inequality.” JAMA, American Medical Association, 3 Apr. 2018, jamanetwork.com/journals/jama/fullarticle/2677433.
“Consumer Price Index for All Urban Consumers: All Items.” FRED, 10 Apr. 2019 http://fred.stlouisfed.org/series/CPIAUCSL.
Dachis, Adam. “How Advertising Manipulates Your Choices and Spending Habits (and What to Do About It).” Lifehacker, 24 June 2013, http://lifehacker.com/how-advertising-manipulates-your-choices-and-spending-h-30812 671.
Dinlersoz, Emin, and Jeremy Greenwood. “The rise and fall of unions in the United States.” Journal of Monetary Economics 83 (2016): 129-146.
“Divergence: Wealth and Income Inequality in the United States.” FRBatlanta, EconSouth, Dec. 2014,
Edlund, L., & Kopczuk, W. (2009). Women, wealth, and mobility. The American Economic Review, 99(1), 146-178. doi:http://dx.doi.org.ezproxy.oswego.edu:2048/10.1257/aer.99.1.146
John et al. “Changes in the Structure of Wages During the 1980’s: An Evaluation of Alternative Explanations.” NBER, NBER, 1 May 1989, http://www.nber.org/papers/w2983.
Oreopoulos, Philip, and Kjell G Salvanes. “How Large are Returns to Schooling? Hint: Money Isn’t Everything” Working Paper 15339, National Bureau of Economic Research, Sept. 2009, www.nber.org/papers/w15339.pdf.
Popescu, Gheorghe H. “Does Student Debt Constitute a Bubble That May Bring about an Educational Crisis?” Educational Philosophy and Theory, vol. 50, no. 2, 2017, 115–118., doi:10.1080/00131857.2017.1300027.
Slemrod, Joel. “Is This Tax Reform, or Just Confusion?” Journal of Economic Perspectives, vol. 32, no. 4, 2018, pp. 73–96., doi:10.1257/jep.32.4.73.
Stone, Chad, et al. “A Guide to Statistics on Historical Trends in Income Inequality.” Center on Budget and Policy Priorities, 11 Dec. 2018, http://www.cbpp.org/research/poverty-and-inequality/a-guide-to-statistics-on-historical-trends-in-income-inequality.
Tavernise, Sabrina. “Education Gap Grows Between Rich and Poor, Studies Say.” The New York Times, The New York Times, 10 Feb. 2012, http://www.nytimes.com/2012/02/10/education/education-gap-grows-between-rich-and-poor-studies-show.html.
“Total Unfilled Job Vacancies for the United States.” FRED, 12 Apr. 2019, http://fred.stlouisfed.org/series/LMJVTTUVUSM647S.
Vila, Luis E. “The Non-Monetary Benefits of Education.” European Journal of Education, vol. 35, no. 1, 2000, pp. 21–32., doi:10.1111/1467-3435.00003.
Wolff, Edward N. “Recent Trends in the Size Distribution of Household Wealth.” Journal of Economic Perspectives, vol. 12, no. 3, 1998, pp. 131–150., doi:10.1257/jep.12.3.131
